Normal Approximation and Sample Size Calculation
Where We Left Off: Exact and Guaranteed
Sampling with replacement
Sampling without replacement
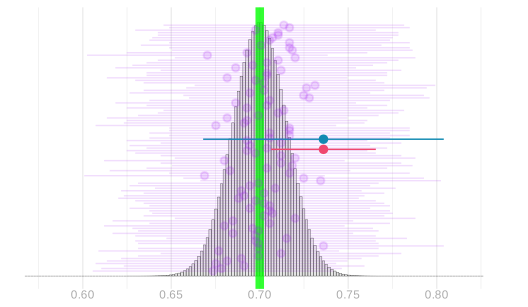
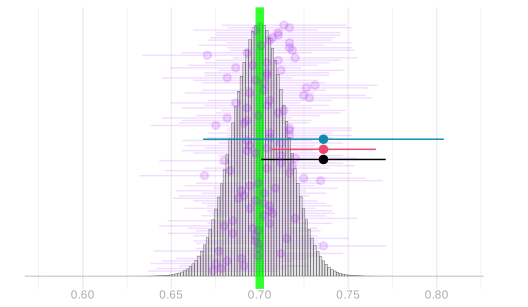
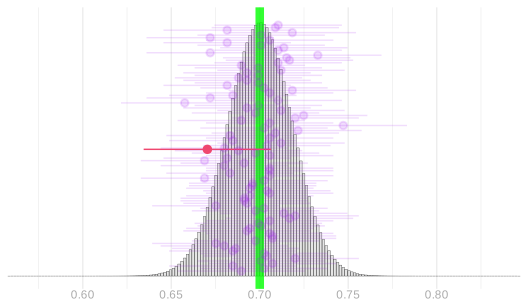
We now have three ways to calibrate an interval estimate.
- Exact.
- Needs the whole sampling distribution.
- We have it for binary responses, sampled with or without replacement.
- Outside that, a pain.
- Chebyshev.
- Needs only the standard deviation.
- Conservative. Who wants to deny themselves precision that’s really there?
- The bootstrap.
- Works, often.
- Not when sampling without replacement, unless n is tiny relative to m.
- A thing you do, not a thing that helps you understand.
The Bootstrap
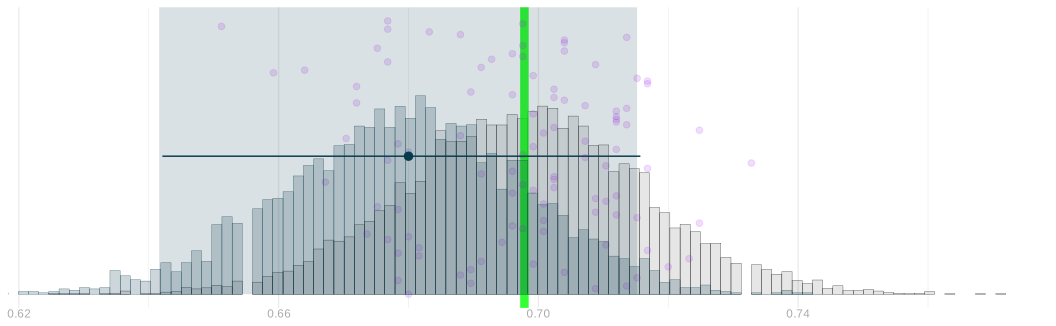
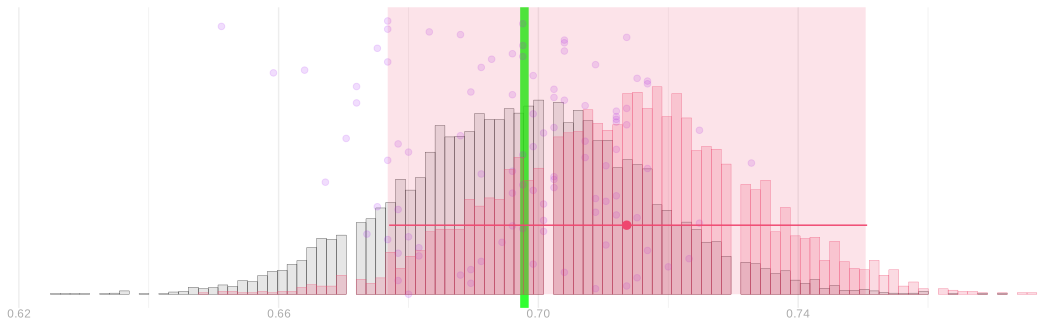
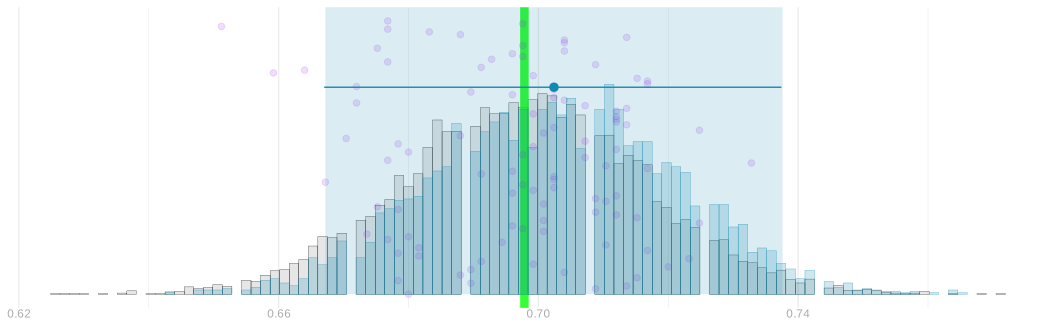
- The bootstrap. A general method for estimating sampling distributions.
- Draw a sample of size n from your sample. A bootstrap sample.
- Calculate your estimator on it. A bootstrap estimate.
- Repeat. The bootstrap sampling distribution.
- This simulates sampling with replacement.
- Not sampling without. There’s no natural analog.
- Great for what we have learned after we have data.
- Not for what we can learn before we have it.
- Today: a tool for that. Normal approximation.
- And a job for it: sample size calculation. Choosing n so your interval is as narrow as you want.
The Normal Distribution
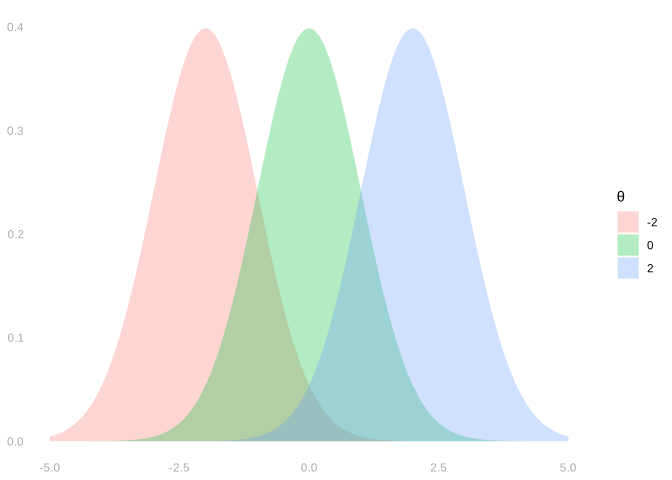
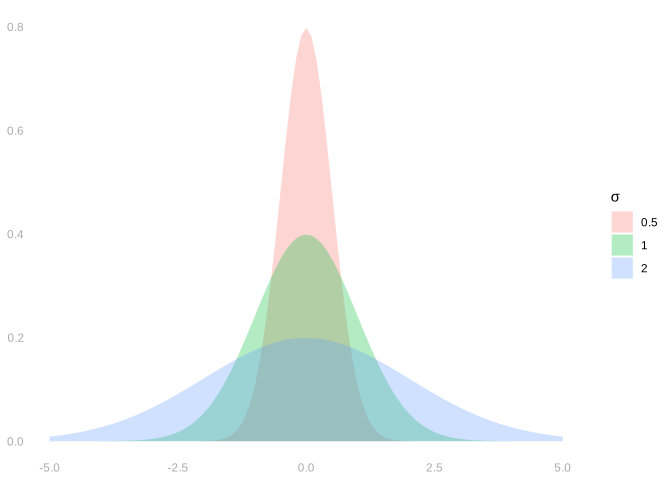
The normal distribution is a parametric family of distributions involving two parameters.
- Its mean, \theta.
- Its standard deviation, \sigma.
We say a random variable X is normally distributed with mean \theta and standard deviation \sigma …
… if the probability that it’s in an interval [a,b] is given by this integral of its probability density. P_{\theta,\sigma}(X \in [a,b]) = \int_a^b f_{\theta,\sigma}(x)dx \qfor f_{\theta, \sigma}(x) = \frac{1}{\sqrt{2\pi}\sigma}e^{-\frac{(x-\theta)^2}{2\sigma^2}}
We have to talk about the probability that it’s ‘in an interval’ rather than that it ‘takes a value’ because …
… the probability it actually takes on any particular value is x zero: it’s an integral from x to x.
Normal Approximation
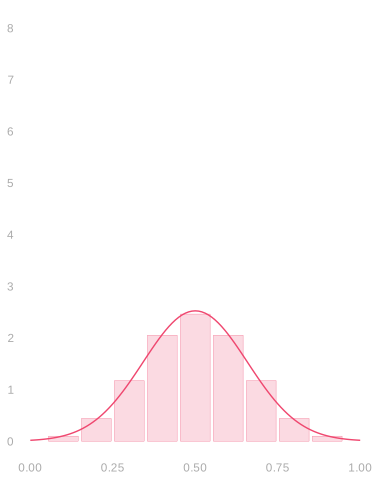
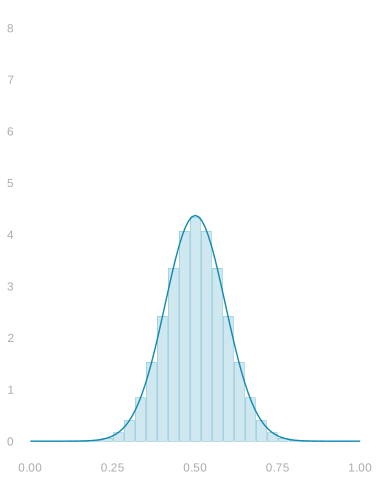
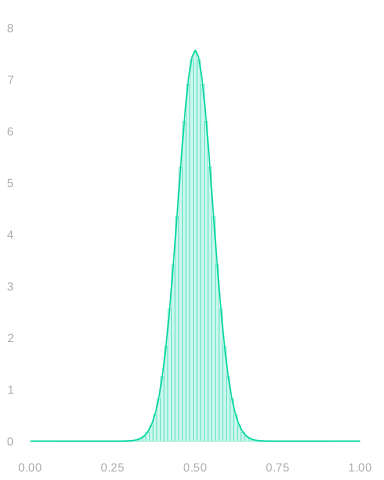
- A distribution’s normal approximation is a normal distribution with the same mean \theta and standard deviation \sigma.
- These show up everywhere because they’re easy to work with and the approximation tends to be good.
- Approximation is good, in particular, for the distribution of a mean of independent random variables.
- Or independent enough ones.
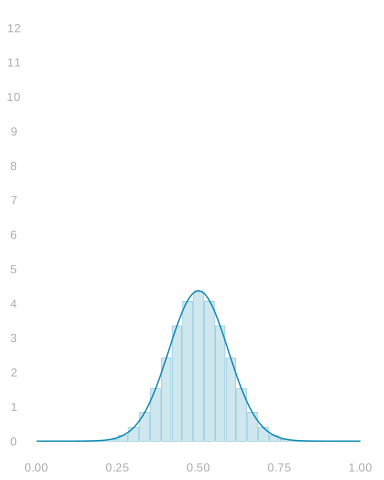
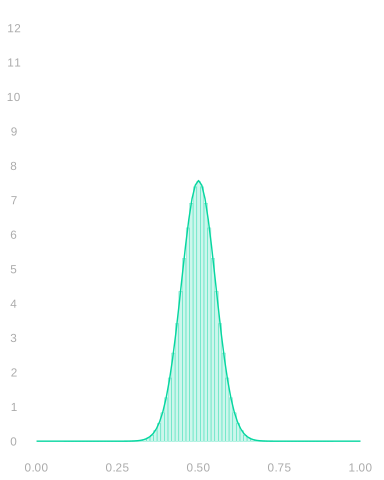
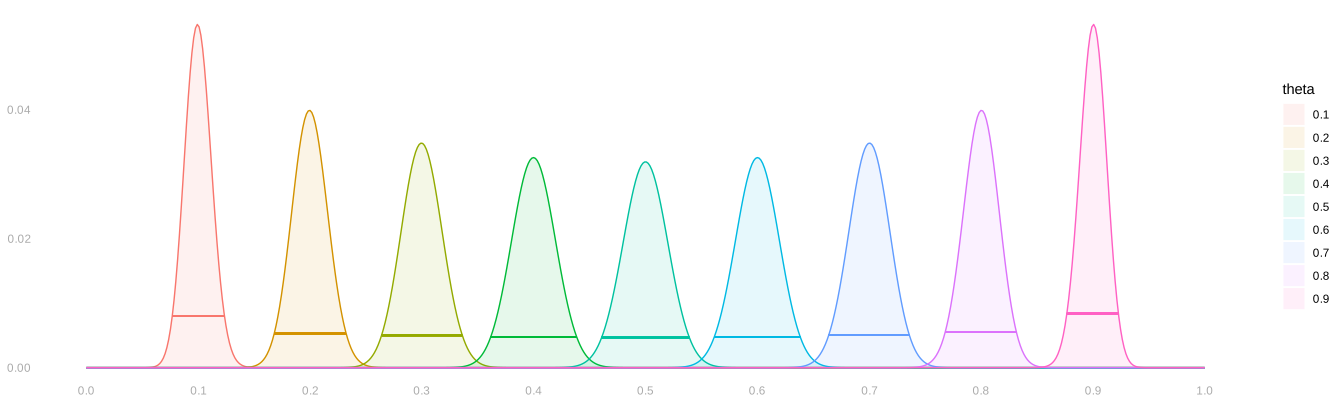
- Above, we see three Binomial distributions with their normal approximations:
- the distributions of the mean of 10, 30, and 90 coin flips.
- These approximations get increasingly accurate as the number of flips n increases.
- That’s universal. It always happens with means. It’s called the Central Limit Theorem.
The Width of Normal Distributions
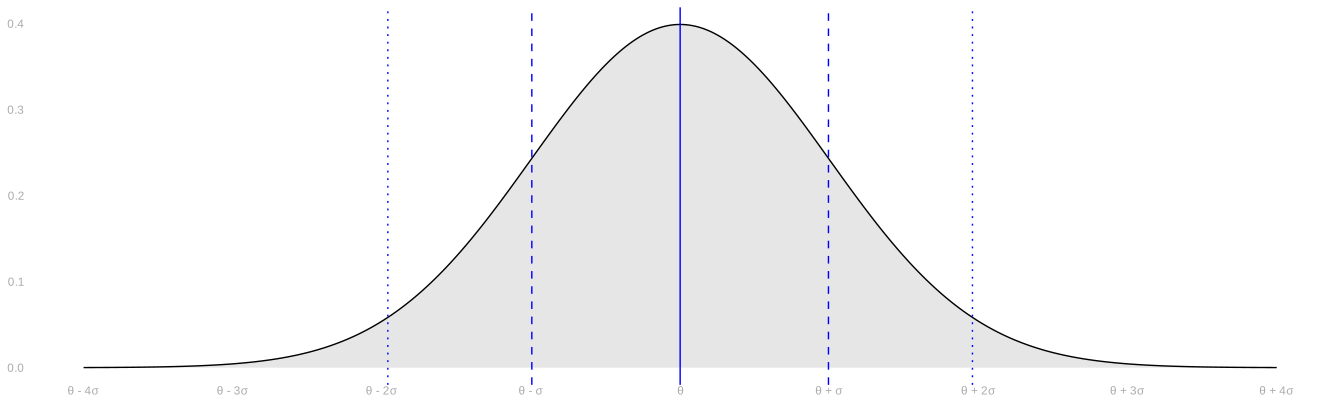
- One thing that’s convenient about the normal distribution is that it’s easy to reason about.
- In particular, it’s easy to reason about the width of its middle x%.
- To include 68.3% of draws, you go out 1 standard deviation from its mean.
- To include 95.4% of draws, you go out 2 standard deviations.
- To include 99.7% of draws, you go out 3 standard deviations.
- To get almost exactly 95% of draws, we go out 1.96 standard deviations: \theta \pm 1.96\sigma.
- Chebyshev got us 95% at \sqrt{20} \approx 4.5 standard deviations. The normal gets it at 1.96.
- Same standard deviation. An interval 2.3\times narrower.
- Two is close enough in practice, but we tend to write 1.96 anyway.
- It’s a signal about what we’re doing. You can get a 2 anywhere in a calculation.
- When you see a 1.96, you know you’re talking about the middle 95% of the normal.
Calibration Using Normal Approximation
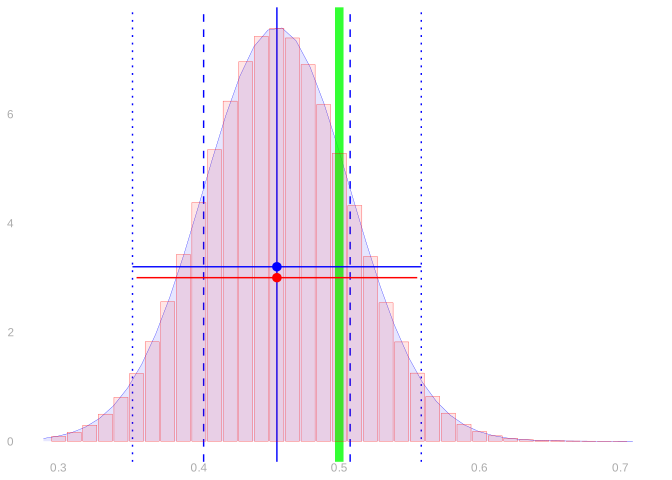
- Calibrating interval estimates using normal approximation is easy.
- You estimate the standard deviation of your point estimator.
- You go out ± 1.96 (estimated) standard deviations from your point estimate.
\text{interval estimate} = \hat\theta \pm 1.96 \hat\sigma
- We’re choosing our interval’s width essentially the same way we always have.
- We’re still using the middle 95% of an estimate of the sample distribution.
- It just looks different because we have a convenient formula for that width.
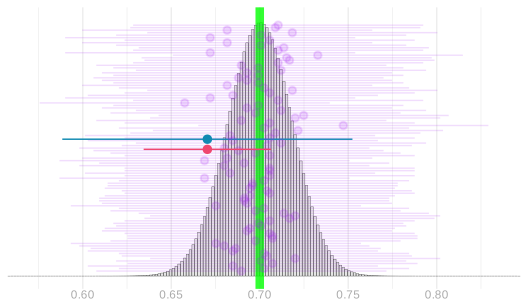
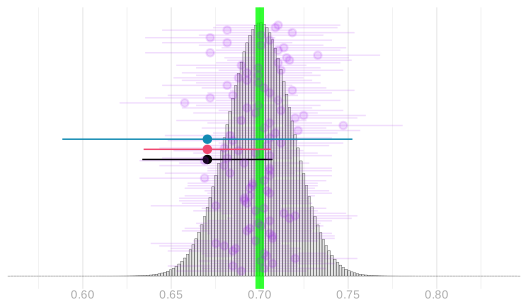
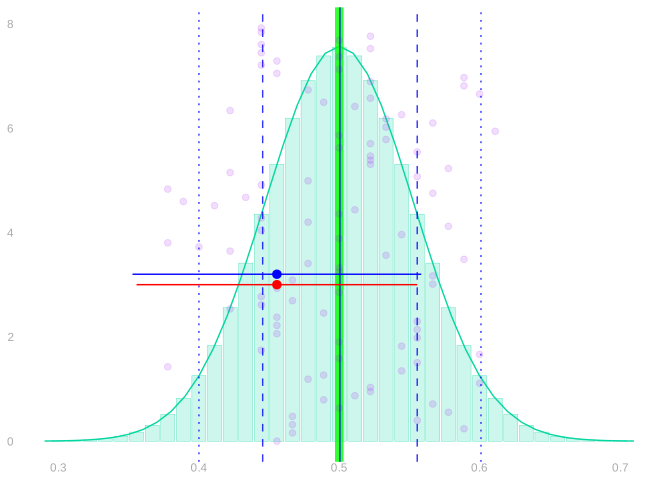
- Above left, you can see two interval estimates superimposed on the sampling distribution of a sample proportion.
- The red one is calibrated using the binomial as before.
- The blue one is calibrated using normal approximation.
- Above right, you can see the binomial and normal sampling distribution estimates these are based on.
When This Works
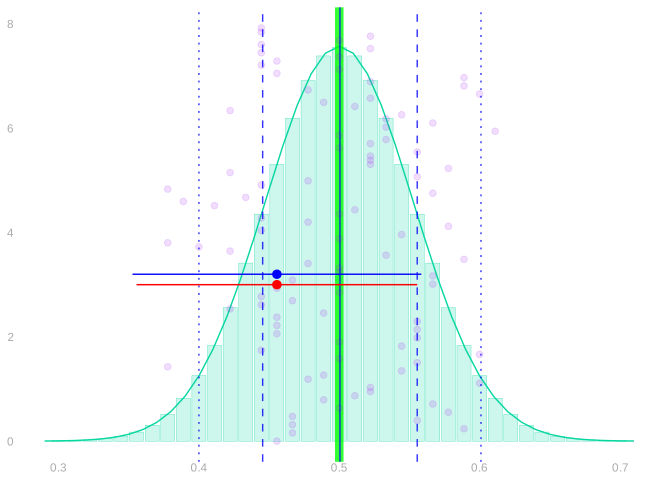
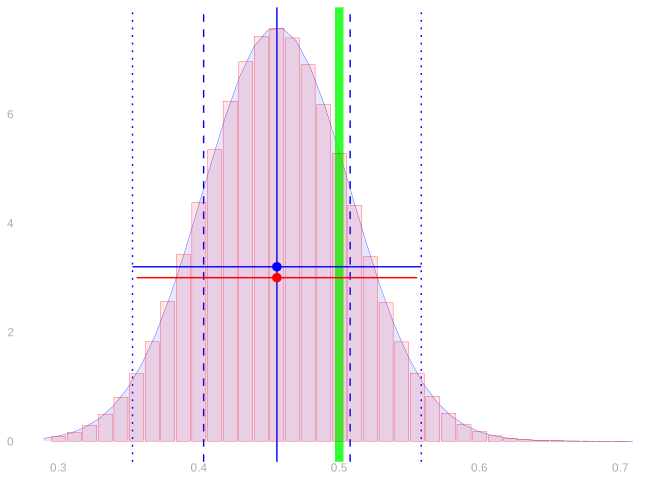
This works if three things are true.
- The sampling distribution needs to be in the right place, i.e. centered on the estimation target.
- This is called unbiasedness of our point estimator.
- Most of the estimators we’ll talk about in this class are unbiased or almost unbiased.
- The sampling distribution needs to be approximately normal.
- The CLT tells us this tends to happen, especially for large n.
- We’ll talk about how accurate it is next week. For most of the estimators we’ll study, you can take it as a given.
- The estimated sampling distribution has approximately the right width.
- This amounts to getting a good estimate of our point estimator’s standard deviation.
- We’ll work on this, again for the sample proportion, later today. And for other estimators throughout the semester.
- It is, however, a bit of a pain. That’s one reason you might prefer the bootstrap.
A Proportion when Sampling with Replacement
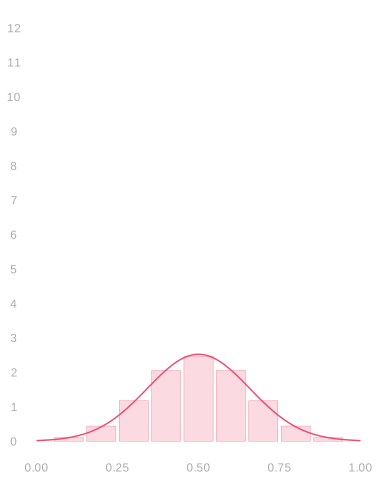
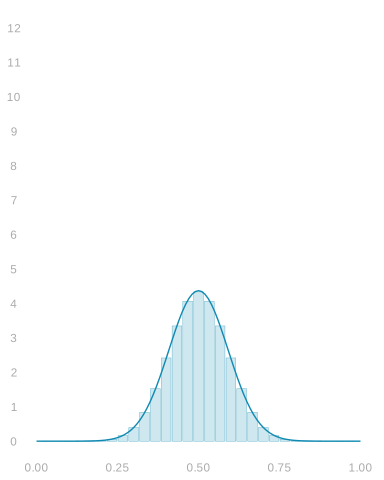
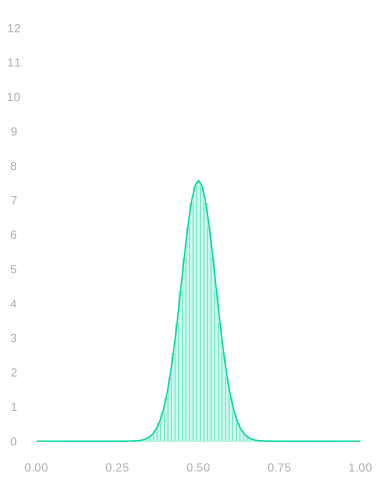
- When we sample from a binary population with replacement, our sample proportion’s distribution is Binomial.
- And we can estimate that distribution by plugging our sample proportion into the Binomial formula.
- But its normal approximation tends to be very good, so we can get away with estimating that instead.
- Its standard deviation is the one we worked out last class.
\begin{aligned} \text{normal approximation} & \ f_{\theta,\sigma}(x) \qfor \sigma^2 = \frac{\theta(1-\theta)}{n} \\ \text{corresponding estimate} & \ f_{\hat\theta, \hat \sigma}(x) \qfor \hat\sigma^2 = \frac{\hat \theta(1-\hat \theta)}{n}. \end{aligned}
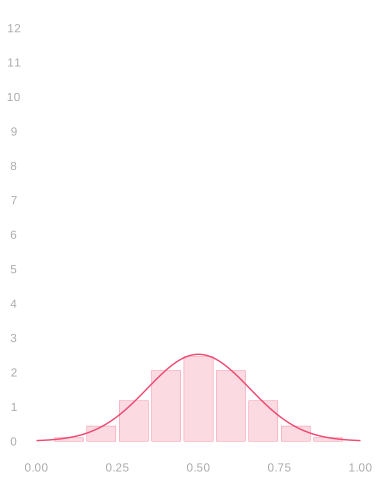
- Pictured: three Binomial distributions with their normal approximations.
- These are the distributions of the sample proportion when we draw a samples of size 10, 30, and 90 …
- … with replacement from a binary population in which the proportion of ones is \theta=.5.
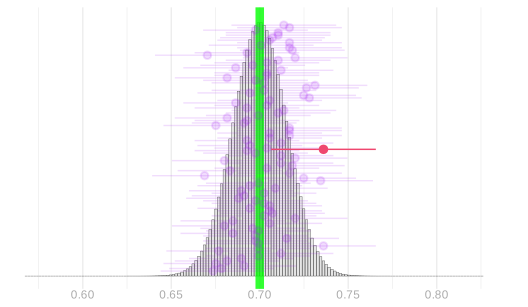
A Proportion when Sampling without Replacement
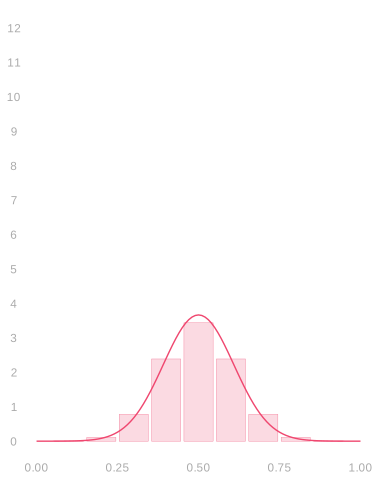
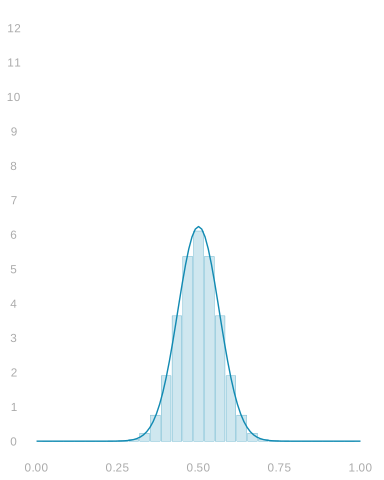
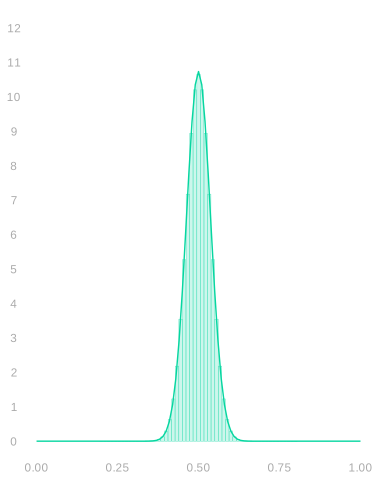
- Sampling without replacement from a binary population, our sample proportion is Hypergeometric.
- We can estimate it by plugging our sample proportion into the Hypergeometric formula.
- But again, its normal approximation is very good, so we can estimate that instead.
- This shows where we go wrong using the Binomial—or equivalently the bootstrap.
- When \color{#404040}n is a meaningful fraction of \color{#404040}m, the Binomial is too wide.
- Its standard deviation is the Binomial’s times \color{#404040}\sqrt{\frac{m-n}{m-1}}. A homework problem.
- When we’re sampling half our population, i.e. n=m/2, that’s roughly \color{#404040}\sqrt{1/2} \approx .7.
\begin{aligned} \text{normal approximation} & \ f_{\theta,\sigma}(x) \qfor \sigma^2 = \frac{\theta(1-\theta)}{n} \times \frac{m-n}{m-1} \\ \text{corresponding estimate} & \ f_{\hat\theta, \hat \sigma}(x) \qfor \hat\sigma^2 = \frac{\hat \theta(1-\hat \theta)}{n} \times \frac{m-n}{m-1}. \end{aligned}
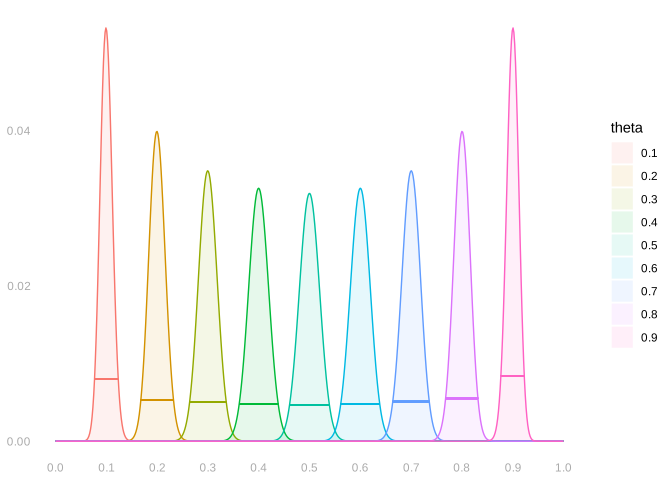
- Pictured: three Hypergeometric distributions with their normal approximations.
- Sample proportions for samples of size 10, 30, and 90 …
- … drawn without replacement from a binary population twice the size with \color{#404040}\theta=.5.
A Mean when Sampling with Replacement
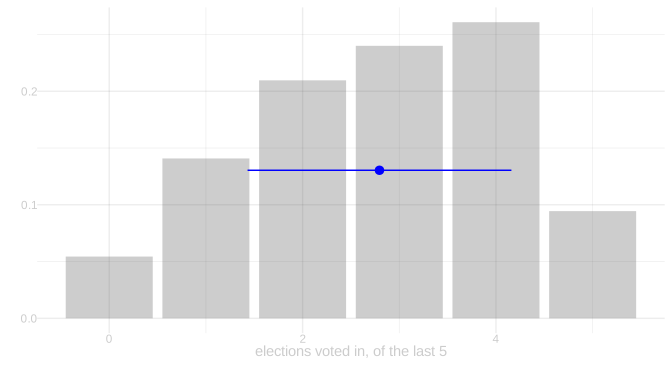
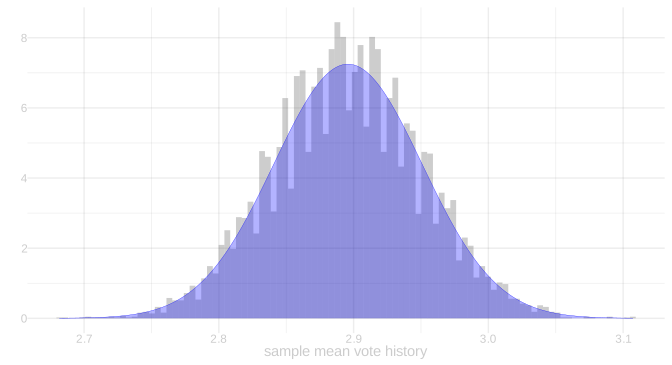
- Not special to proportions. Take the average vote history \bar H_n.
- Its standard deviation is the population standard deviation over \sqrt{n}. Plug in the sample’s.
\begin{aligned} \text{normal approximation} & \ f_{\mu,\sigma_n}(x) \qfor \sigma_n^2 = \frac{\sigma_H^2}{n} \qqtext{for} \sigma_H^2 = \frac{1}{m}\sum_{j=1}^m (h_j - \mu)^2 \\ \text{corresponding estimate} & \ f_{\bar H_n, \hat \sigma_n}(x) \qfor \hat\sigma_n^2 = \frac{\hat\sigma_H^2}{n} \qqtext{for} \hat\sigma_H^2 = \frac{1}{n}\sum_{i=1}^n (H_i - \bar H_n)^2. \end{aligned}
- Pictured: left, the 625 sampled voters’ vote histories with \bar H_n and the sample standard deviation.
- Right, the sampling distribution of \bar H_n over draws from the population, with its normal approximation.
Using Normal Approximation
- What makes all this work is that we’re using good estimates of our estimator’s standard deviation.
- If we have a formula for the estimator’s standard deviation, this is usuallly not so hard.
- We estimate whatever population summaries show up in the formula and plug them in.
An Interval for Turnout in 2020
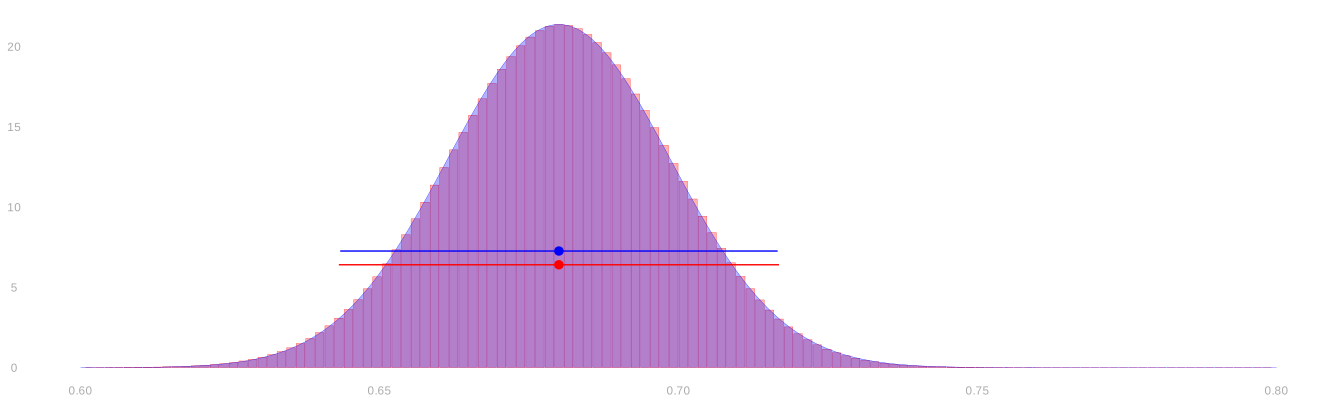
- Let’s compare our two approaches to calibration in our turnout poll.
\begin{aligned} \textcolor{red}{\text{binomial interval}} &= 0.6800 \pm 0.0368 \\ \textcolor{blue}{\text{normal interval}} &= 0.6800 \pm 0.0366 \end{aligned}
- We have to go out to 4 digits, way beyond what’s statistically meaningful, to see any difference in these intervals.
- Our interval estimate—either one—is telling you might be off by a few hundredths.
- Who cares about another couple ten-thousandths at the edge of the interval?
Thinking Speculatively About Intervals
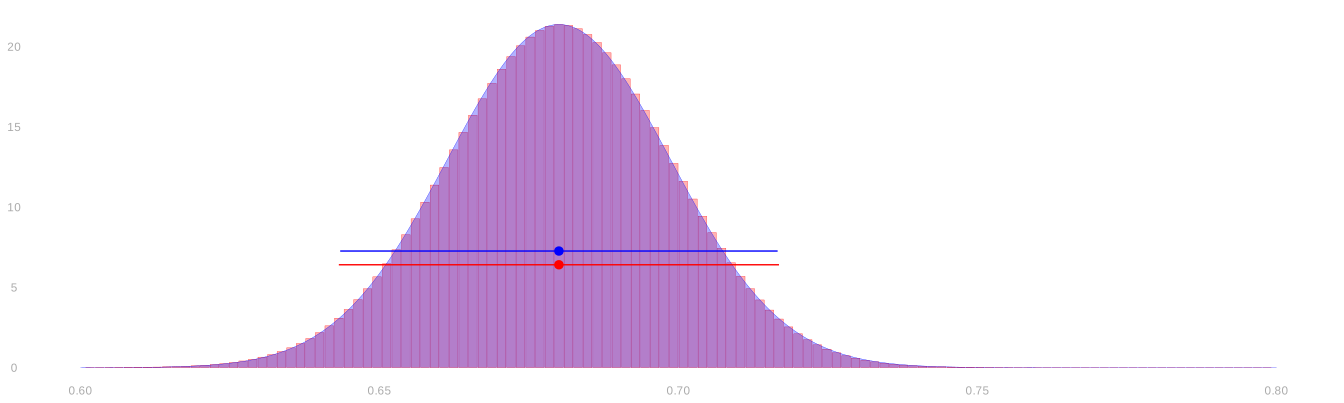
- Suppose we’re not satisfied with this level of precision, so we’re going to collect more data.
- Suppose we want our interval to be \pm .01 instead of \pm 0.037.
- How many people, in total, do we need to call? We can use the normal approximation to figure that out.
\hat \theta \pm 1.96\sigma_n \qfor \sigma_n = \sqrt{\frac{\theta (1-\theta)}{n}} \qqtext{ is } \hat\theta \pm .01 \qqtext{if} 1.96\sqrt{\frac{\theta (1-\theta)}{n}} = .01
- Now all we have to do is solve for n. And, since we don’t know \theta, use our best guess, \hat\theta=0.68.
n = \frac{1.96^2 \ \hat\theta (1-\hat\theta)}{.01^2} \approx 8000
Starting from Scratch
What do we do if we don’t have any data yet?
- Then we don’t have a ‘current interval width’ to compare to the ‘desired interval width’.
- And we don’t have a sample proportion \hat\theta to plug in for the population proportion \theta.
But we can still use the formula we worked out earlier to get somewhere. 1.96\sqrt{\frac{\theta (1-\theta)}{n}} = .01 \qqtext{so} n = \frac{1.96^2 \ \theta (1-\theta)}{.01^2}
We don’t have an estimate of \theta, but we do know it’s between 0 and 1. And, consequently, so is \theta(1-\theta).
So we know that if we just substitute 1 into our formula, we’ll get a number that’s bigger than we need.
n < n' = \frac{1.96^2 \cdot 1}{.01^2} \approx 38400
That’s a bit excessive. In fact, we can substitute in 1/4 instead of 1. n < n' = \frac{1.96^2 \cdot 1/4}{.01^2} \approx 9600
Much better. That’s pretty close to the number we got with preliminary data.
Why Can We Use 1/4?
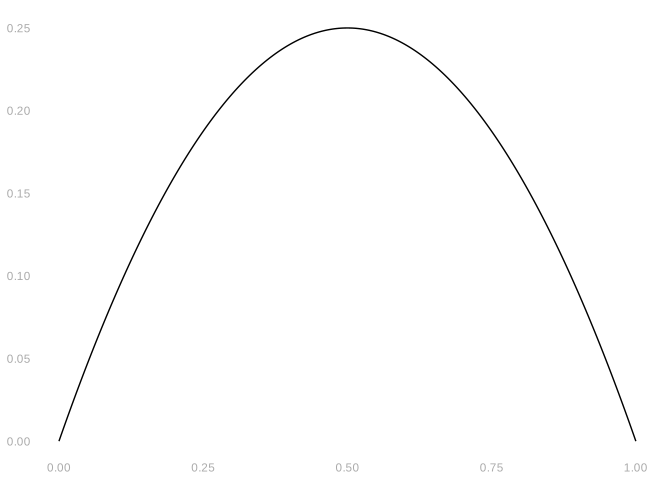
Here’s the claim. Why is it true? n := \frac{1.96^2 \ \theta (1-\theta)}{.01^2} < n' := \frac{1.96^2 \ \times 1/4}{.01^2}
Hint. Look at the graph of f(x) = x(1-x) above.
- Because 1/4 is the biggest \theta (1-\theta) gets for \theta \in [0,1].
- And it happens, for what it’s worth, when \theta = 1/2.
- That is, we’ll have the least precision — at a given sample size — when the proportion we’re estimating is 1/2.
The National Supported Work Demonstration
| n | \hat \mu | sample SD |
|---|---|---|
| 185 | 6300 | 7900 |
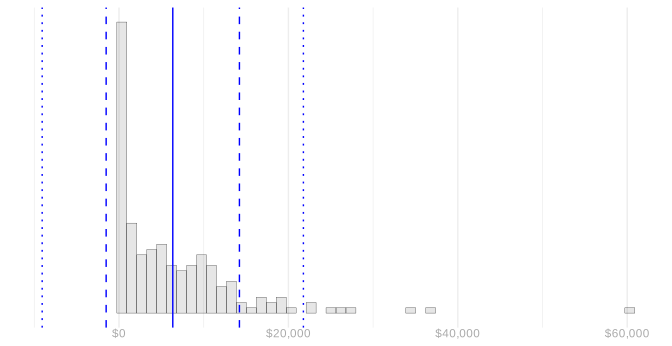
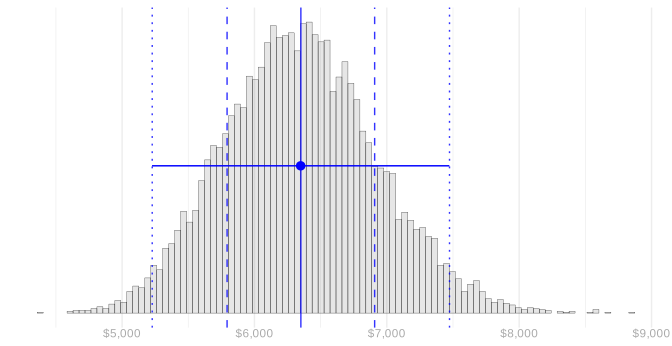
- The National Supported Work Demonstration was an experimental program in the 1970s that provided job training and other services.
- Here ‘experimental’ doesn’t just mean untested. It was run as a big experiment.
- From a population of eligible people, they drew a sample of size 445 to participate.
- To help estimate the impact of the program, participants were randomized into two groups.
- The ‘treated’ group received the training and services.
- The ‘control’ group did not.
- Today we’ll look at the treated group only: 185 people.
- A year or two after the program ended, they looked at the incomes of the people who’d been treated.
- The average within the sample was about $6300 per year. In 1978 dollars.
- A dollar in 1978 was worth about what $5 is today.
- So adjusting for inflation, that’s an in-sample average of about $31700.
- But the sample was relatively small. And, as a result, the interval estimate is pretty wide.
\begin{aligned} \mu &\in 6300 \pm 1100 \approx [5200, \ 7500] &&\qqtext{is a 95\% confidence interval in 1978 dollars} \\ &\in 31700 \pm 5600 \approx [26100, \ 37400] &&\qqtext{adjusted for inflation} \end{aligned}
Activities
| n | \hat \mu | sample SD |
|---|---|---|
| 185 | 6300 | 7900 |
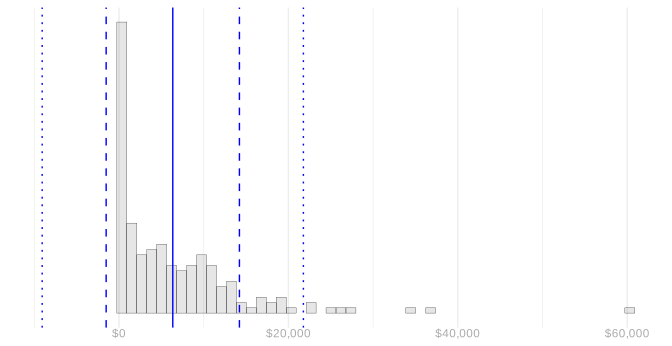
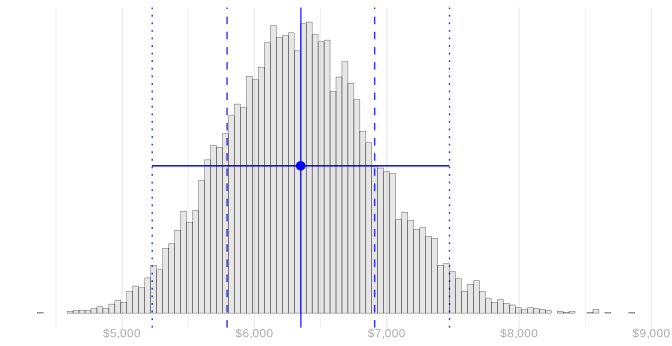
- Use the information in this table and the formulas to calculate a 95% interval based on normal approximation.
- Compare it to the interval we got using the bootstrap sampling distribution for calibration.
- Suppose we want to know the population mean to within $500 (1978 dollars).
- How can we resize our study to make that happen?
- We could run a second wave, drawing more people from the same population exactly as before, to get a larger sample like the one we have.
- What sample size would we need to be able to get a 95% confidence interval this accurate?
Solutions and Discussion
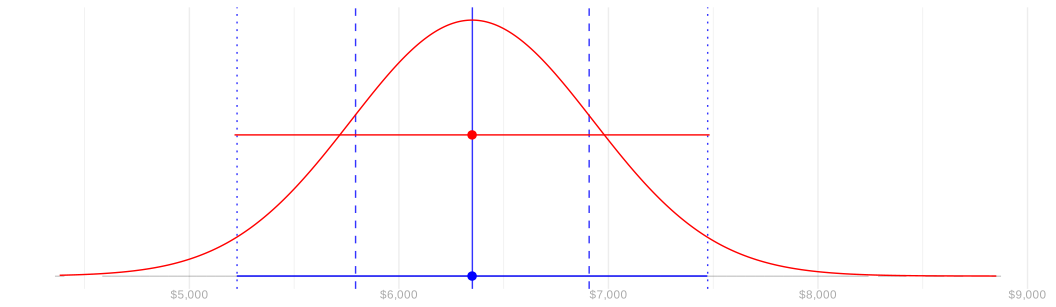
Figure 22
- Warm-Up. \hat\mu \pm 1.96\,\hat\sigma_n, with \hat\sigma_n the sample standard deviation over \sqrt{n}.
- 6300 \pm 1.96 \times 7900/\sqrt{185} \approx 6300 \pm 1100. The bootstrap gave \pm 1100.
- Resizing, the hard way. Just like the turnout poll: we want \pm 500 instead of \pm 1130.
\hat\mu \pm 1.96\hat\sigma_n \qfor \hat\sigma_n = \frac{\hat\sigma_Y}{\sqrt{n}} \qqtext{ is } \hat\mu \pm 500 \qqtext{if} 1.96\frac{\hat\sigma_Y}{\sqrt{n}} = 500
- Now all we have to do is solve for n, using the sample standard deviation \hat\sigma_Y = 7900.
n = \frac{1.96^2 \ \hat\sigma_Y^2}{500^2} \approx 950
- Resizing, the easy way. Compare the interval width we have to the one we want.
\begin{aligned} \pm 1130 &= \pm 1.96\hat\sigma_{185} \qfor \hat\sigma_{185} = \frac{\hat\sigma_Y}{\sqrt{185}} \\ \pm 500 &= \pm 1.96\hat\sigma_n \qfor \hat\sigma_n = \frac{\hat\sigma_Y}{\sqrt{n}} \end{aligned}
- All that changes is the sample size. The sample size ratio falls out of the interval width ratio.
\frac{1130}{500} = \frac{1.96\hat\sigma_{185}}{1.96\hat\sigma_n} = \sqrt{\frac{n}{185}} \qqtext{ so } n = 185\left(\frac{1130}{500}\right)^2 \approx 950